Price action is one of the most fundamental and versatile tools in forex trading. By focusing on raw price movements, traders can gain valuable insights into market behavior without relying heavily on technical indicators. This guide will help you understand the basics of price action and how to use it effectively to interpret market moves.
What is Price Action?
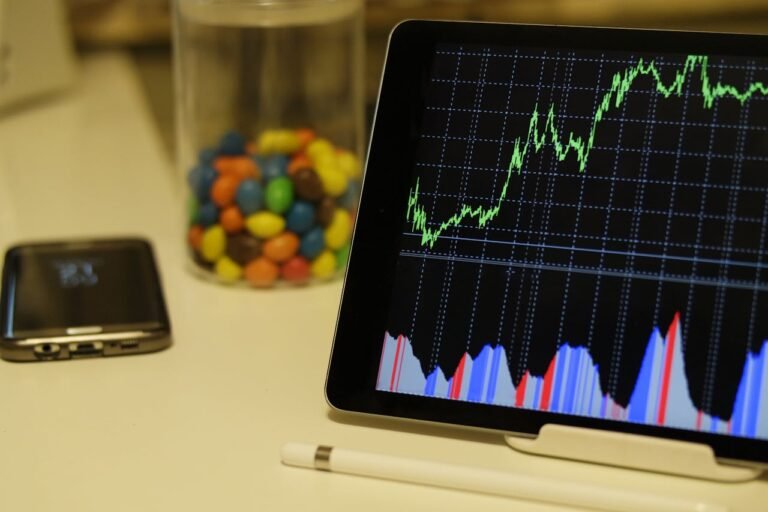
Price action refers to the movement of a currency pair’s price over time, represented visually on a chart. It reflects the balance of supply and demand, offering clues about market sentiment and potential future movements. Unlike strategies that rely on lagging indicators, price action is based on real-time market data, making it a preferred approach for many traders.
Why Use Price Action in Forex?
There are several benefits to using price action as part of your trading strategy:
- Clarity: Focuses on the essential data, reducing chart clutter caused by multiple indicators.
- Adaptability: Can be applied to all timeframes and trading styles, including scalping, day trading, and swing trading.
- Real-Time Insights: Offers a direct view of market sentiment and momentum.
Key Price Action Components
1. Candlestick Patterns
Candlesticks are the building blocks of price action analysis. They provide insights into market sentiment within a specific time period. Common patterns include:
- Pin Bar: Indicates potential reversals with a small body and a long wick.
- Engulfing Candle: Suggests a strong shift in momentum, with the second candle engulfing the previous one.
- Doji: Represents indecision in the market, where the open and close prices are nearly the same.
2. Support and Resistance Levels
Support and resistance are key areas where price tends to react. These levels are formed based on historical price data and indicate zones of demand (support) and supply (resistance).
- Support: A price level where buyers are likely to step in, preventing further declines.
- Resistance: A price level where sellers are likely to step in, capping further increases.
3. Trendlines
Trendlines are diagonal lines drawn across significant price points to identify trends. They help traders visualize the market’s direction and determine potential breakout points.
4. Price Patterns
Patterns formed by price movements can signal potential market moves. Popular patterns include:
- Head and Shoulders: Indicates a potential reversal from an uptrend to a downtrend.
- Double Top/Bottom: Suggests a reversal at key resistance or support levels.
- Triangles: Represent consolidation before a potential breakout.
How to Trade Using Price Action
1. Identify Key Levels
Mark significant support and resistance levels on your chart. These zones often serve as entry or exit points for trades.
2. Watch for Price Action Signals
Look for candlestick patterns or other price formations near key levels to confirm potential trades.
3. Confirm with Context
Analyze the broader market trend and combine price action signals with additional tools like volume analysis or moving averages for confirmation.
4. Manage Risk
Use stop-loss orders to protect your capital and ensure your trade size aligns with your risk management rules.
Common Mistakes to Avoid
- Ignoring the Bigger Picture: Always consider the broader market context when analyzing price action.
- Overtrading: Avoid forcing trades when clear price action signals are absent.
- Failing to Adapt: Price action evolves, so be flexible and adjust your strategy as market conditions change.
Conclusion
Understanding price action is an invaluable skill for forex traders. By learning to read candlestick patterns, identify support and resistance levels, and recognize key price formations, you can gain deeper insights into market behavior and make informed trading decisions. Practice on a demo account to refine your skills before applying them to live trading.