In forex trading, the Morning Star candlestick pattern is a reliable reversal signal, often seen at the end of a downtrend and indicating a potential shift to an uptrend. Identifying this pattern on a real chart requires practice and understanding of price action and trends. Let’s explore how to spot the Morning Star pattern and use it effectively in live trading.
What is the Morning Star Pattern?
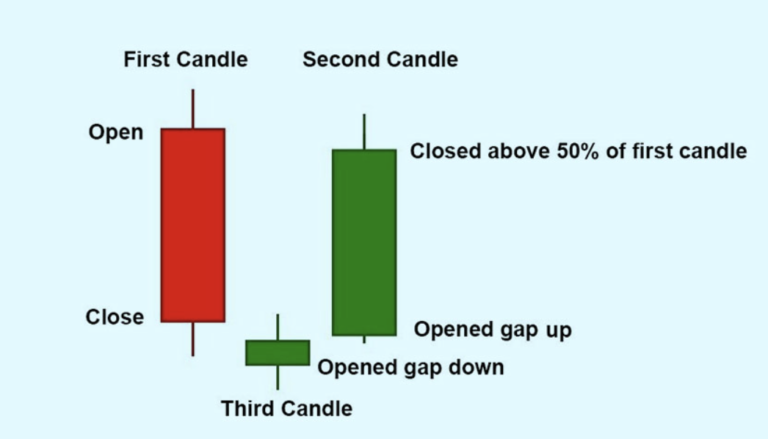
The Morning Star is a three-candle formation that appears at the bottom of a downtrend. It typically consists of:
- First Candle: A long bearish candle representing strong selling momentum.
- Second Candle: A smaller-bodied candle, often with a gap. This candle may be bullish or bearish and represents market indecision.
- Third Candle: A long bullish candle that closes above the midpoint of the first candle, confirming a reversal to the upside.
This sequence reflects a transition from bearish control to bullish dominance, making it a popular choice for traders looking to enter long positions at the beginning of an uptrend.
Steps to Recognize the Morning Star Pattern on a Real Chart
Spotting the Morning Star pattern on a real chart involves looking for specific signs of reversal. Here’s how:
- Identify a Downtrend: Look for a clear downtrend before the Morning Star pattern appears. It’s essential to confirm a downtrend to validate the potential for a reversal.
- First Candle (Bearish): Locate a strong bearish candle with a long body, which indicates strong selling pressure.
- Second Candle (Small Body): The second candle should have a smaller body, ideally gapping down. This candle shows hesitation in the trend and may appear as a doji or spinning top.
- Third Candle (Bullish): The third candle should be a long bullish one that closes above the midpoint of the first candle, signaling a reversal in sentiment.
Using Volume to Confirm the Morning Star Pattern
Volume can enhance the reliability of the Morning Star pattern. A high volume on the third candle often supports the bullish reversal. Watch for a noticeable increase in volume as the third candle forms, as this can confirm the buying momentum driving the trend change.
Practical Example of the Morning Star Pattern
Imagine you are analyzing the EUR/USD chart and spot a strong downtrend. A long bearish candle forms, followed by a small-bodied candle, which may have gapped down slightly. The third candle then forms, closing above the midpoint of the first candle. This Morning Star formation, coupled with high volume on the bullish candle, signals a potential entry point for a long trade.
Placing Trades Using the Morning Star Pattern
Here’s a step-by-step guide to trading the Morning Star pattern:
- Wait for the Pattern to Complete: Ensure the third candle closes above the midpoint of the first before taking any action.
- Enter Long: Once confirmed, consider entering a long position at the close of the third candle.
- Set Stop-Loss: Place your stop-loss below the low of the pattern to protect against downside risk.
- Define Your Profit Target: Aim for recent resistance levels or use a favorable risk-to-reward ratio, such as 1:2 or 1:3, to set your target.
Things to Remember
Using the Morning Star pattern effectively on a live chart takes practice. Here are some reminders:
- Use Additional Indicators: Complement the Morning Star with indicators like RSI, MACD, or moving averages to improve accuracy.
- Look for Volume Confirmation: Volume spikes on the third candle often validate the bullish reversal.
- Check for Key Support Levels: The Morning Star is more effective when it forms around major support areas, as these levels strengthen the reversal signal.
Limitations of the Morning Star Pattern
While powerful, the Morning Star has its limitations:
- False Signals: In choppy markets, the pattern may lead to false reversals.
- Reliance on Volume: Lack of volume confirmation on the third candle can reduce reliability.
Conclusion
The Morning Star candlestick pattern is a valuable tool in forex trading, helping traders identify bullish reversals and trend changes. Recognizing this pattern on real charts requires careful observation of price action, trend context, and volume. By following the steps outlined above, you can use the Morning Star to enhance your trading strategy and identify potential long opportunities in the forex market.