In forex trading, a sideways breakout occurs when the price breaks out of a consolidation phase where the market has been moving within a range, neither trending upward nor downward. This breakout is significant because it can signal the start of a new trend, either bullish or bearish. Identifying a sideways breakout can provide traders with valuable opportunities to enter trades at the beginning of these trends.
What is a Sideways Market?
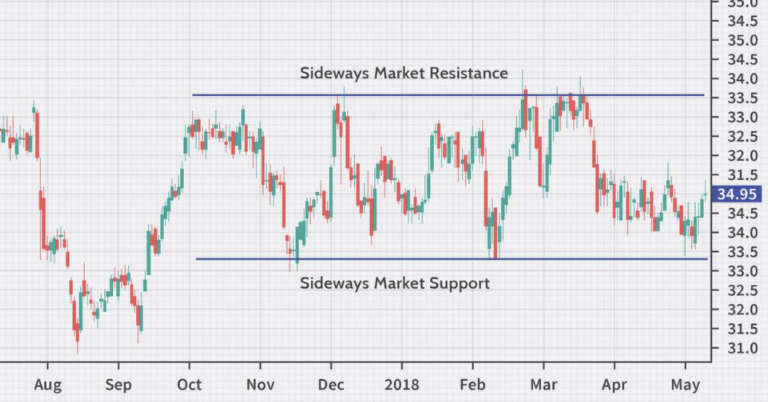
A sideways market happens when the price moves within a relatively narrow range, without any clear direction. The price bounces between defined support and resistance levels. Traders often refer to this as a consolidation or ranging market, where no trend is dominant. This period can last for hours, days, or even weeks before a breakout occurs.
What is a Sideways Breakout?
A sideways breakout happens when the price finally breaks through either the support or resistance level of the range. This breakout signals that the market is ready to move into a new phase, typically either an upward trend (bullish breakout) or a downward trend (bearish breakout). The breakout often happens after a period of low volatility, making it easier to spot.
How to Identify a Sideways Breakout
Recognizing a sideways breakout is essential to capitalize on new trends. Here are some common ways to identify a breakout from a sideways market:
1. Breakout from Support or Resistance
The most straightforward way to identify a breakout is when the price breaks through either the support or resistance level of the sideways range. A bullish breakout occurs when the price breaks above resistance, while a bearish breakout happens when the price breaks below support. Traders often wait for confirmation, such as a candle closing above resistance or below support, before entering a trade.
2. Increased Volume
Breakouts are often accompanied by a noticeable increase in trading volume. This increase in volume shows that more participants are entering the market, pushing the price out of its range. Volume can serve as a confirmation that the breakout is valid and not a false breakout.
3. Volatility Expansion
A period of low volatility typically precedes a breakout. When the price suddenly shows an increase in volatility—meaning larger price movements—it can signal the start of a breakout. Bollinger Bands are a popular indicator for measuring volatility, and a breakout often occurs when the bands expand after a period of contraction.
4. Technical Indicators
Various indicators can help identify a sideways breakout, including:
- Moving Averages: When the price crosses over a moving average after a sideways period, it may signal a breakout.
- Relative Strength Index (RSI): A breakout is more likely when the RSI moves out of an overbought or oversold zone.
- ADX (Average Directional Index): A rising ADX after a low reading during consolidation can indicate the beginning of a new trend.
False Breakouts
Not all breakouts lead to sustained trends. A false breakout occurs when the price breaks out of a range but quickly returns within it. This can trap traders who entered the market too soon. To avoid false breakouts, it’s important to wait for confirmation, such as a candlestick closing outside the support or resistance level, along with other indicators like volume and volatility.
Sideways Breakout Trading Strategies
Once you’ve identified a potential breakout, there are several strategies to capitalize on the movement:
1. Breakout Trading
In a breakout strategy, traders enter the market as soon as the price breaks above resistance (for a bullish breakout) or below support (for a bearish breakout). This strategy works best when combined with other confirmation tools, such as volume or technical indicators.
2. Retest Strategy
Many traders wait for the price to retest the breakout level. After breaking through support or resistance, the price often pulls back to test the level it just broke. If the level holds, it confirms the breakout, and traders can enter the trade with more confidence.
Conclusion
A sideways breakout marks the transition from a period of consolidation to a new trending phase. Identifying and acting on these breakouts can lead to profitable trading opportunities. By watching for key indicators like support/resistance breakouts, increased volume, and volatility expansion, traders can better position themselves to capture these moves and avoid false breakouts.