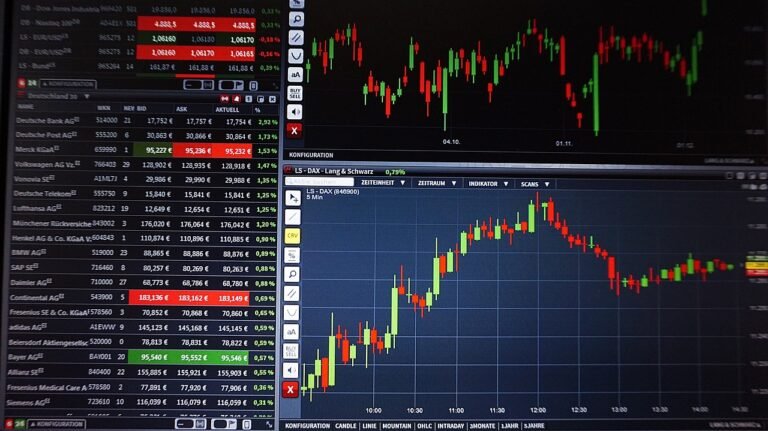
The Ichimoku Cloud, or Ichimoku Kinko Hyo, is a versatile technical analysis tool that helps traders assess market trends, momentum, and key support and resistance levels. Its unique structure allows traders to gain a comprehensive view of market conditions at a glance, making it highly effective for identifying trading opportunities.
Key Functions of Ichimoku Cloud
Here are the primary functions of the Ichimoku Cloud in trading:
1. Identifying Market Trends
The Ichimoku Cloud provides a clear visual representation of the market’s direction:
- Uptrend: When the price is above the cloud, it signals a bullish trend.
- Downtrend: When the price is below the cloud, it indicates a bearish trend.
- Consolidation: When the price is within the cloud, it suggests a neutral or sideways market.
2. Highlighting Support and Resistance Levels
The cloud, or Kumo, acts as a dynamic support or resistance zone:
- Support: In an uptrend, the cloud serves as a cushion where the price may bounce higher.
- Resistance: In a downtrend, the cloud acts as a barrier, preventing the price from rising further.
3. Measuring Momentum
The Tenkan-sen (Conversion Line) and Kijun-sen (Base Line) help traders gauge price momentum:
- Tenkan-sen: Reflects short-term momentum, calculated over 9 periods.
- Kijun-sen: Indicates medium-term momentum, calculated over 26 periods.
The interaction between these two lines provides signals for potential trend changes.
4. Generating Entry and Exit Signals
The Ichimoku Cloud offers several trading signals to guide entry and exit points:
- Bullish Signal: When the Tenkan-sen crosses above the Kijun-sen, it suggests a buy opportunity.
- Bearish Signal: When the Tenkan-sen crosses below the Kijun-sen, it indicates a sell opportunity.
- Confirmation signals are stronger when the price is above or below the cloud in line with the trend.
5. Predicting Future Price Movements
The leading spans (Senkou Span A and Senkou Span B) project future support and resistance levels. This forward-looking feature sets the Ichimoku Cloud apart from other indicators, allowing traders to anticipate price reactions in advance.
6. Assessing Market Strength
The thickness of the cloud indicates the strength of a trend:
- Thick Cloud: Represents strong support or resistance and indicates a robust trend.
- Thin Cloud: Suggests weaker support or resistance and potential market volatility.
Conclusion
The Ichimoku Cloud is a powerful tool for traders, providing insights into trends, momentum, and key levels of support and resistance. Its ability to generate reliable signals and predict future price movements makes it an essential component of any trading strategy. By understanding and leveraging its functions, traders can make more informed and confident decisions in the market.