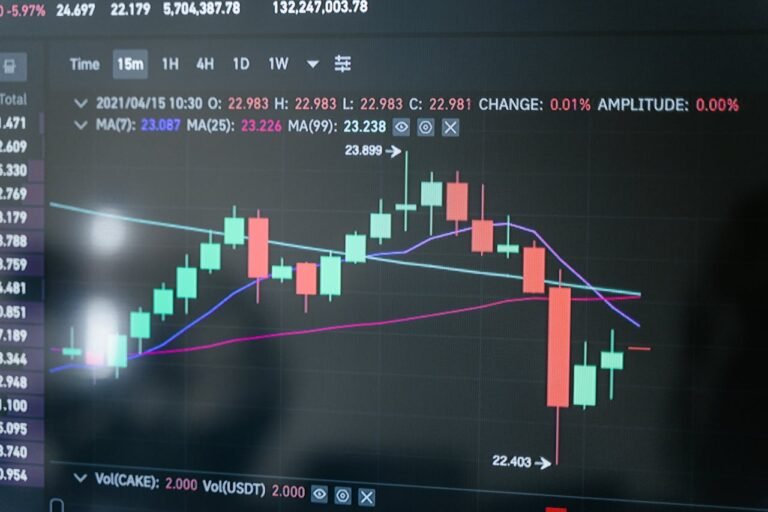
Successful trading requires the ability to adapt strategies based on market conditions. One of the critical skills for traders is recognizing whether the market is trending or moving sideways and applying the appropriate approach to maximize profits and minimize risks.
Understanding Trending Markets
A trending market occurs when prices move consistently in one direction—either upward (bullish trend) or downward (bearish trend). Trends are often characterized by higher highs and higher lows in an uptrend or lower highs and lower lows in a downtrend.
Key Characteristics of a Trending Market:
- Clear directional movement.
- Increased trading volume during the trend’s establishment.
- Strong momentum supported by fundamental or technical factors.
Strategies for Trading in Trending Markets:
- Follow the Trend: Use trend-following indicators such as Moving Averages or MACD to identify and ride the trend.
- Breakout Trading: Enter trades when the price breaks significant support or resistance levels, signaling the start of a trend.
- Use Trailing Stops: Lock in profits by setting a trailing stop that adjusts with the trend.
Understanding Sideways Markets
A sideways market, also known as a range-bound market, occurs when prices fluctuate between a defined support and resistance level without a clear direction. Sideways markets are typically observed during periods of low volatility or market indecision.
Key Characteristics of a Sideways Market:
- Price moves within a horizontal range.
- Low trading volume compared to trending markets.
- Frequent reversals near support and resistance levels.
Strategies for Trading in Sideways Markets:
- Range Trading: Buy near support and sell near resistance, taking advantage of predictable price movements.
- Oscillator Indicators: Use tools like the RSI or Stochastic Oscillator to identify overbought and oversold conditions within the range.
- Wait for Breakouts: Monitor for breakouts that signal the end of the sideways phase and the start of a new trend.
How to Identify Market Conditions
Recognizing whether the market is trending or moving sideways is crucial. Here are some methods:
- Technical Indicators: Use Moving Averages, ADX, or Bollinger Bands to determine market direction and strength.
- Chart Patterns: Observe price action for patterns like ascending triangles (trending) or rectangles (sideways).
- Market Context: Stay informed about economic events or news that could influence market behavior.
Examples of Trading Approaches
Trending Market Example:
Suppose EUR/USD is in a strong uptrend. A trader might use the 50-day Moving Average to enter long positions whenever the price pulls back to the average.
Sideways Market Example:
For a range-bound market like USD/JPY, a trader could buy near support at 130.00 and sell near resistance at 132.00, relying on RSI to confirm overbought and oversold conditions.
Common Mistakes to Avoid
- Forcing Trades: Avoid trading when market conditions are unclear.
- Using the Wrong Indicators: Trend-following indicators may produce false signals in sideways markets and vice versa.
- Ignoring Market Transitions: Be vigilant for transitions from trending to sideways markets or vice versa.
Conclusion
Understanding the difference between trending and sideways markets is vital for tailoring your trading strategy. By identifying market conditions accurately and applying the appropriate techniques, traders can increase their chances of success. For more insights on trading strategies, visit our blog.