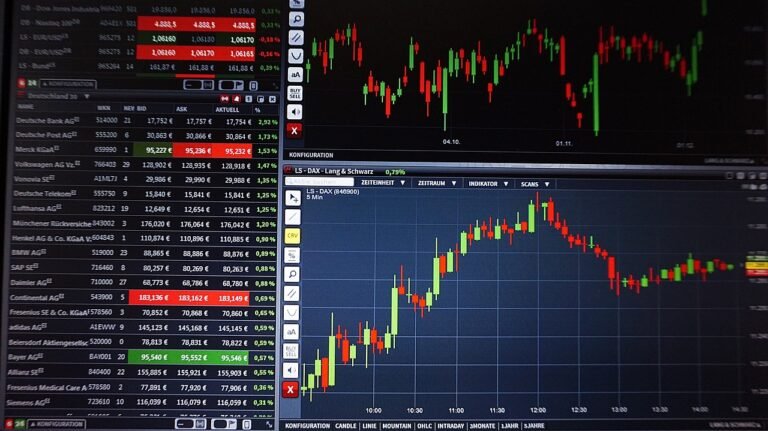
In forex trading, a trendline is one of the simplest and most commonly used tools to identify trends and potential trade opportunities. It’s a straight line that connects two or more price points on a chart and helps traders visually determine the direction of the market. Whether you’re a beginner or an experienced trader, understanding how to draw and use trendlines effectively can make a significant difference in your trading strategy.
In this article, we’ll cover the basics of trendlines, their importance in technical analysis, and how to apply them in your trading strategy to maximize profits and minimize risks.
What is a Trendline?
A trendline is a line drawn on a chart to show the direction of the price movement. It serves as a visual representation of the trend, helping traders spot the prevailing market direction, whether it’s upward (bullish), downward (bearish), or sideways (range-bound). Trendlines can also act as dynamic support and resistance levels that guide traders in making better decisions regarding entry and exit points.
There are two main types of trendlines:
- Uptrend Line (Bullish Trendline): This line is drawn by connecting a series of higher lows, indicating an upward trend. It suggests that the market is making new highs and higher lows, which signals a bullish market.
- Downtrend Line (Bearish Trendline): This line is drawn by connecting a series of lower highs, indicating a downward trend. It suggests that the market is making lower highs and lower lows, which signals a bearish market.
How to Draw a Trendline
Drawing a trendline is relatively straightforward, but it requires precision and attention to detail. Here are the basic steps:
- Identify the Trend: Look at the price chart and determine whether the market is in an uptrend, downtrend, or moving sideways. In an uptrend, you’ll connect the lows, and in a downtrend, you’ll connect the highs.
- Connect Two or More Points: To draw a valid trendline, you need to identify at least two significant points. For an uptrend, connect the higher lows. For a downtrend, connect the lower highs. The more points you connect, the more reliable the trendline will be.
- Extend the Line: Once you’ve connected the points, extend the line into the future to anticipate where the price might move next. This projection helps traders spot potential entry or exit points as the price approaches the trendline.
While drawing a trendline may seem simple, its accuracy depends on choosing the right points and using them consistently.
How to Use Trendlines in Forex Trading
Trendlines offer traders various ways to improve their trading strategy. Here’s how you can use them effectively:
- Identify the Trend: The primary function of a trendline is to help traders identify the current market trend. An upward-sloping trendline indicates a bullish market, while a downward-sloping trendline signals a bearish market. Knowing the trend helps traders align their positions with the market direction.
- Find Entry and Exit Points: Trendlines act as dynamic support or resistance levels. In an uptrend, traders can look for buy opportunities when the price bounces off the trendline (support). In a downtrend, traders may look for sell opportunities when the price touches the trendline (resistance).
- Confirm Trend Reversals: A break of the trendline can signal a potential trend reversal. For example, if the price breaks below an uptrend line, it may indicate that the bullish momentum is weakening, and a downtrend could be forming. Similarly, a break above a downtrend line suggests the start of a bullish trend.
- Adjust Stop-Loss and Take-Profit Levels: Traders can use trendlines to set stop-loss and take-profit orders. Placing stop-loss orders below the trendline in an uptrend or above the trendline in a downtrend can help protect profits or limit losses.
Common Mistakes When Using Trendlines
Although trendlines are simple to use, many traders make some common mistakes that reduce their effectiveness. Here are a few things to avoid:
- Forcing Trendlines: Some traders force trendlines by connecting points that don’t align properly, leading to inaccurate predictions. Only use points that clearly demonstrate a trend.
- Relying Solely on Trendlines: While trendlines are a helpful tool, they shouldn’t be the only indicator in your trading strategy. Combine trendlines with other technical tools, such as moving averages or oscillators, for confirmation.
- Not Adjusting Trendlines: As market conditions change, trendlines may need adjustments. If new highs or lows form, consider redrawing the trendline to ensure accuracy.
Conclusion
Trendlines are a fundamental part of technical analysis and a great tool for traders looking to improve their performance. They provide a clear and visual way to identify the market’s direction, determine key entry and exit points, and confirm potential trend reversals. By understanding how to draw and use trendlines correctly, you can enhance your forex trading strategy and make more informed decisions.
However, remember that trendlines are just one of many tools you should use in your trading arsenal. For best results, combine them with other technical indicators to strengthen your trading strategy.